- < Experiment 1
-
Experiment 2 v6
- Experiment 3 >
Fractions heat map

How does the value of a fraction change as you adjust the top and bottom parts?
Purpose
This experiment gives children an opportunity to see the decimal representations of lots of fractions and to practise using a calculator.
The child will learn that the value of a fraction increases as the numerator increases and decreases as the denominator increases. They will also be exposed to a different type of chart: a heat chart, which uses colour to show patterns in values.
You need to know
- the top part of a fraction is called the numerator
- the bottom part of a fraction is called the denominator
- how to calculate a fraction using a calculator (divide the numerator by the denominator)
- how to round a decimal to two decimal places
You will need


Steps
-
With your pencil and ruler, draw a grid on the squared paper like the one shown below.
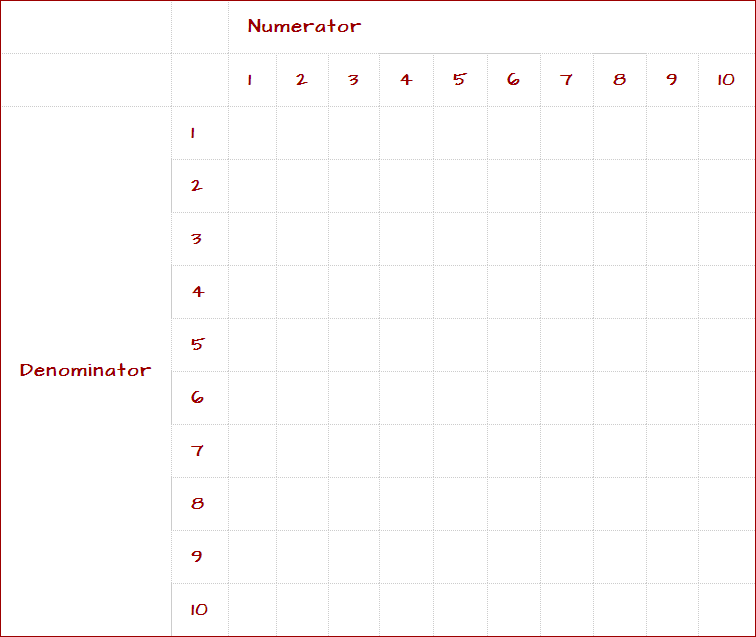
- The first cell in the grid represents a numerator of 1 and a denominator of 1. You don't need a calculator to work this out: 1 ÷ 1 = 1. We will be working to two decimal places. Write the value 1.00 in the first cell.
- The cell below this represents a numerator of 1 and a denominator of 2. This is the fraction 1 ÷ 2 = 0.5. Write 0.50 in this cell.
- Fill in the rest of the values in the grid, using a calculator where necessary.
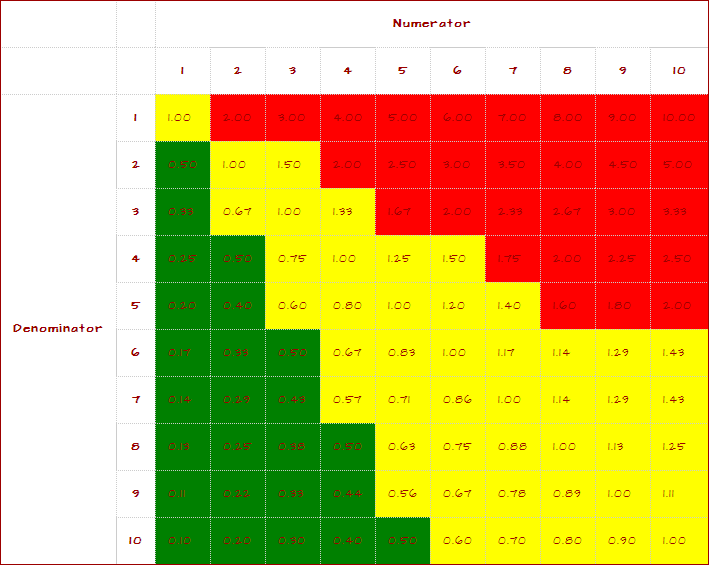
- Using your green coloured pencil, colour in all the values less than or equal to 0.5.
- Using your yellow coloured pencil, colour in all the values more than 0.5 but less than or equal to 1.5.
-
Using your red coloured pencil, colour in all the values more than 1.5.
Your completed grid is an example of a heat map.
Questions
- Which part of the grid has the smallest values?
- Which part of the grid has the largest values?
- What happens to the values as the denominator increases?
- Which of these fractions is larger: 45/77 or 47/77?
- What happens to the values as the numerator increases?
- Which of these fractions is larger: 45/77 or 45/78?
- Can you find any other patterns in the values?
Expected answers
-
The smallest values are in the bottom left of the grid.
-
The largest values are in the top right of the grid.
-
As you increase the denominator, the values increase.
-
47/77 is larger (there are more 77ths).
-
As you increase the numerator, the values decrease.
-
45/77 is larger (a 77th is larger than a 78th, so 45/77 is larger than 45/78).
-
Possible patterns include the 1.00 values on the diagonal (because the numerator and denominator are equal for these). Also, the decimal part of the values to the right of the 1.00 on each row repeat the values at the start of each row (because, for example, 7/6 is 1 1/6).
The completed grid should look like this:
Explore further (optional)
Try to find some other examples of heat maps.
Tips for further exploration
The Wikipedia entry for heat map is a good starting point.


